About the tool
Use this tool to identify the carbon-intensive products and services that your organization uses!
This tool synthesizes more than 86 GHG analyses conducted by 36 organizations – cities, counties, public utilities, and higher education institutions. It identifies carbon-intensive products and services purchased by those organizations. The results of this compilation will help organizations that do not have the resources to conduct a GHG analysis on their supply chain (or the production of goods and services) determine the scale of their impact. As a result, goods and services they buy can be included in their GHG emissions reduction efforts.
Uses of the tool
Organizations that do not have the expertise or resources to conduct their own supply chain GHG analysis can use the Tool to identify potential GHG reductions and areas for priority action by reviewing results from similar organizations. Institutions planning to conduct or having completed a GHG supply chain inventory can use the Tool to design their inventory, validate their own results, and benchmark their priorities.
The Trends Analysis Tool will help institutions focus on strategic targets by providing additional information on the drivers or “hot spots” for specific impact categories.
For instance:
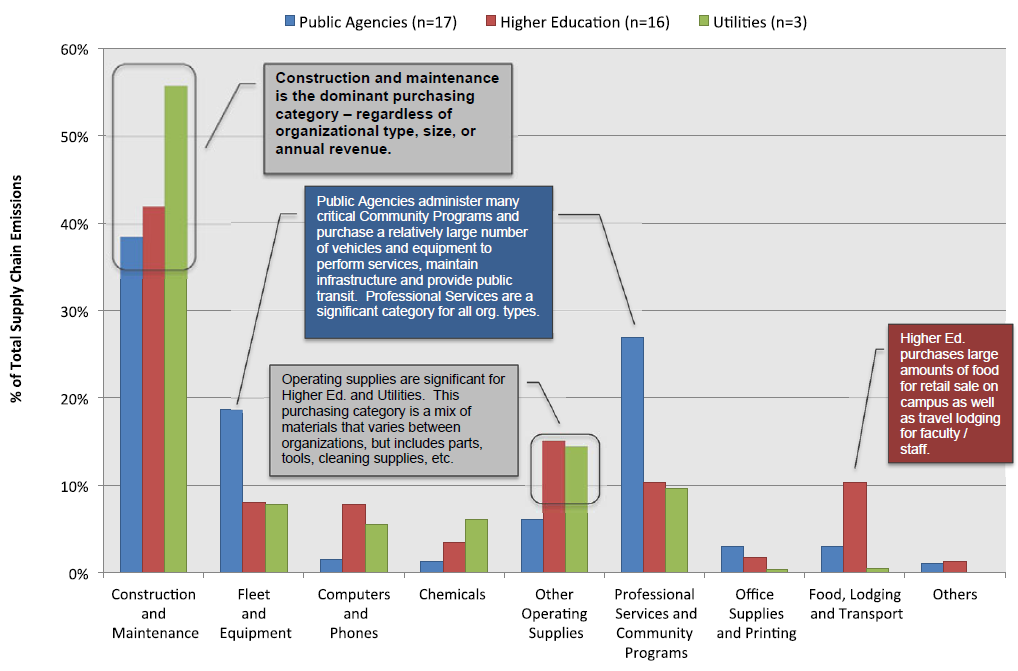
- Construction and maintenance has the highest GHG emissions of all purchasing categories regardless of the institution’s type, size, or annual budget (between 38% – 56% of total supply chain emissions). The largest drivers or “hot spots” of GHG emissions for this category include production of materials such as concrete, asphalt and metals, and fuel combustion for vehicles and equipment.
- Professional Services represent at least 10% of supply chain emissions for all organizational types, and when only public agencies supply chains are consider, this rises to ~27% of total emissions. The largest sources of GHG emissions for professional services include natural gas and electricity use, and business travel by service providers
- Understand the climate impact of purchases relative to other common GHG emissions sources
- Identify “hot spots” within supply chain emissions – purchasing categories and specific goods and services
- Help target strategic procurement activities to reduce supply chain impacts
By understanding more about those categories of spending that have especially high GHG emissions, government and higher education purchasers can zero in on the most effective strategies for reducing their carbon footprint. They can specify actions such as the use of recycled content products, energy efficient and lower-GHG processes for material production, low GHG fuels and energy efficient vehicles and equipment, and lower emissions meetings for contractors vis-à-vis teleconferencing.
Percentage of Total Supply Chain Emissions, by Organizational Type, and Purchasing Category
Trend Analysis Report